AAL Testing Suites
Pulp and Paper
Within our Pulp and Paper testing suite, AAL offers two test groups unique to the Pulp and Paper industry. Terpenes and Resin Acids are two...

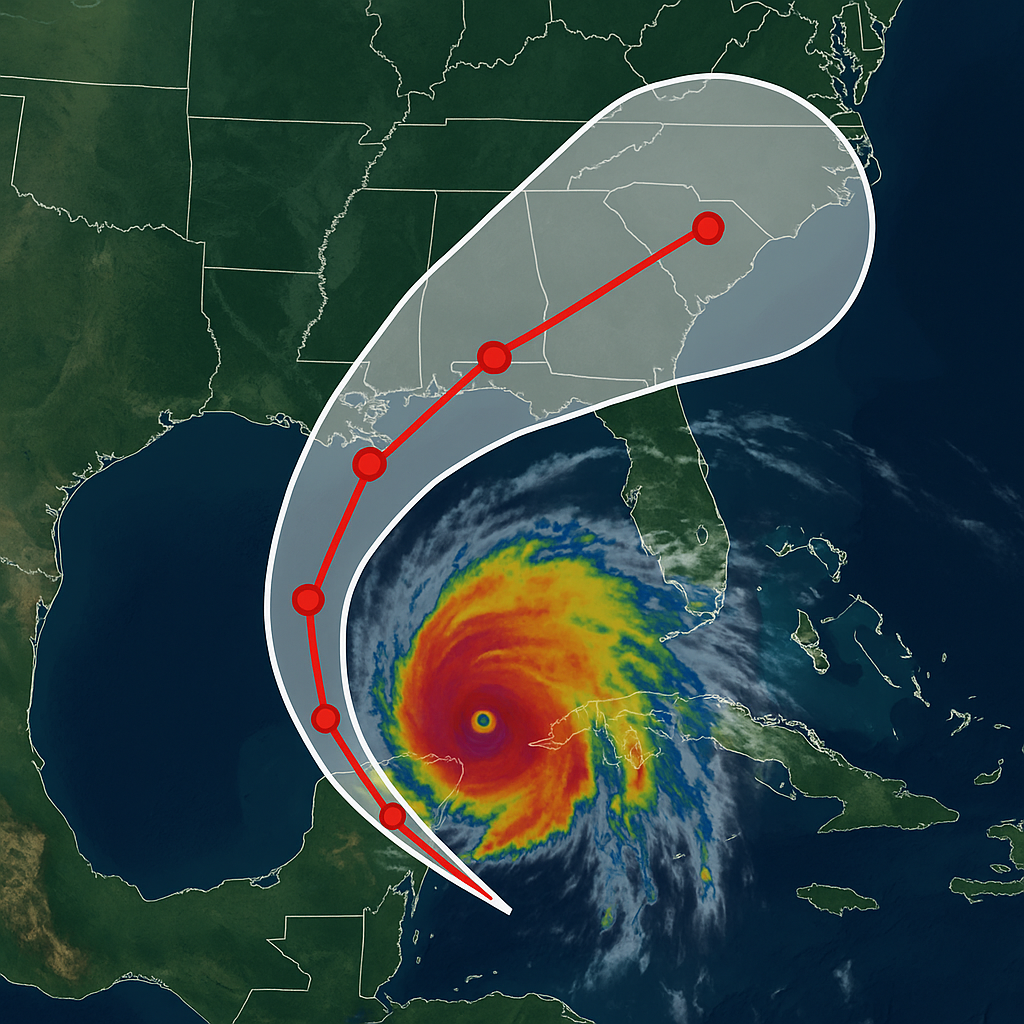
Severe storms and hurricanes can cause widespread devastation—damaging infrastructure, displacing employees, and disrupting operations. For industrial facilities...

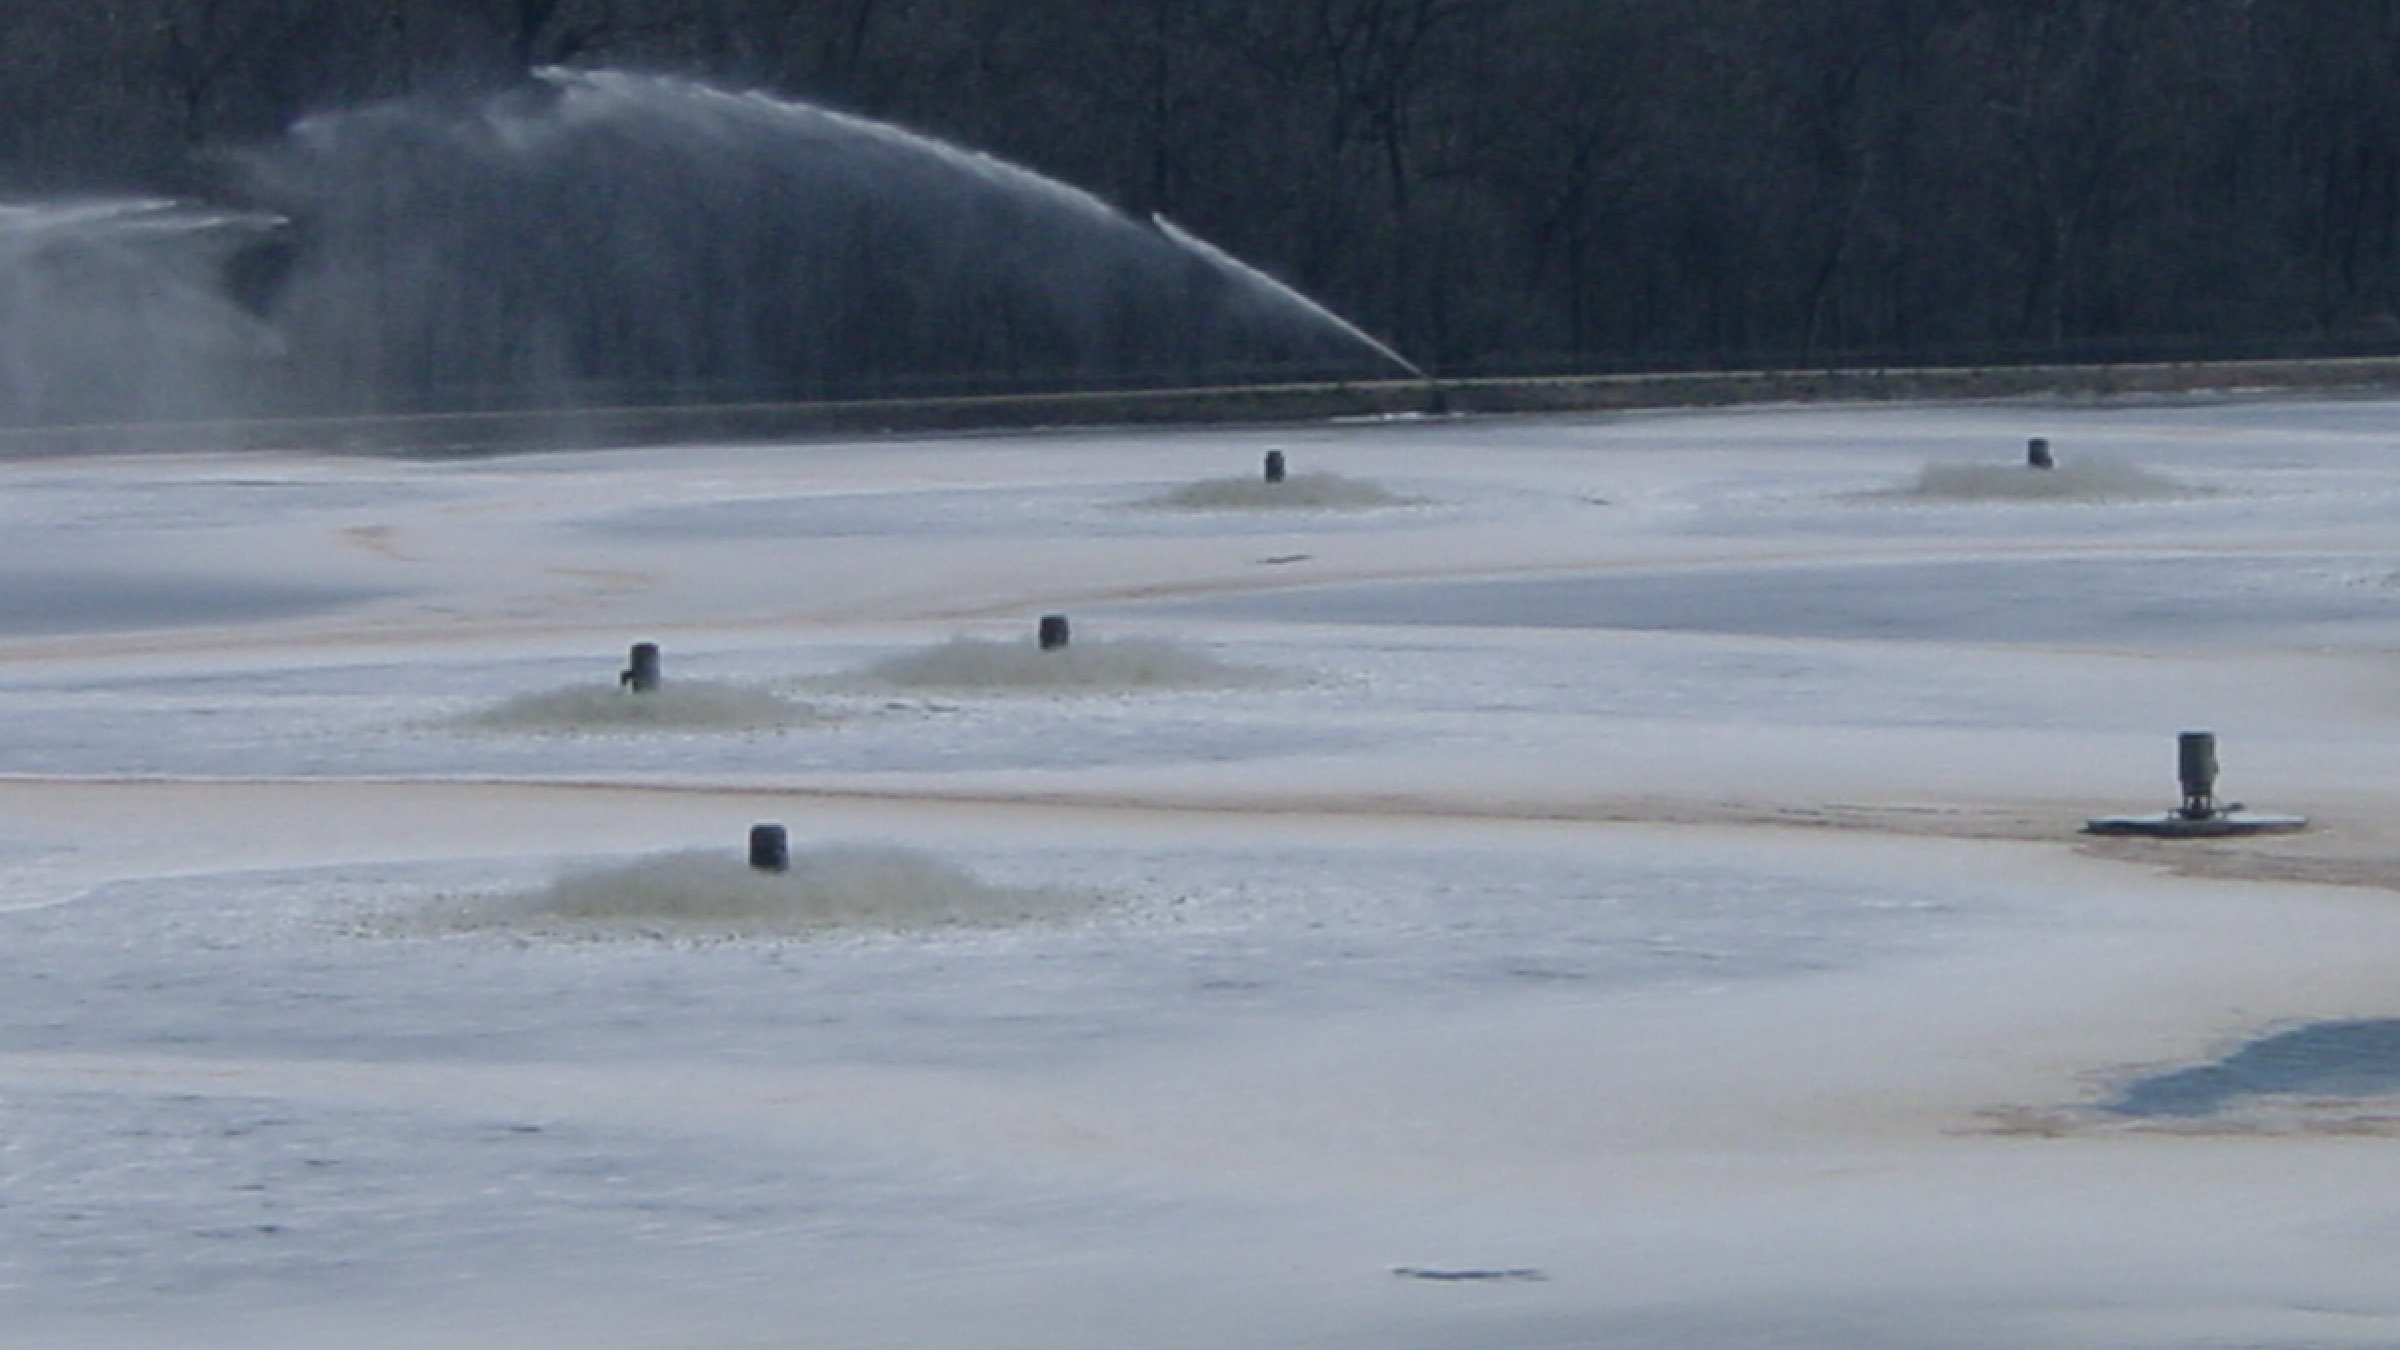
EBS recently assisted a paper mill with odor issues associated with their aerated stabilization basin (ASB) wastewater treatment system. The formation of reduced...
At Environmental Business Specialists LLC (EBS), we continually search for ways to enhance our laboratory tests to not only suit...
There are 2 major types of systems used for wastewater treatment: aerobic and anaerobic systems....
 There are 2 major types of systems used for wastewater treatment: aerobic and anaerobic systems. Each has different uses along with pros and cons. This particular article focuses on anaerobic treatment. Aerobic treatment is the focus of a companion article written by EBS.
Anaerobic treatment is a process where wastewater or material is broken down by microorganisms without the aid of dissolved oxygen. However, anaerobic bacteria can and will use oxygen that is found in the oxides introduced into the system or they can obtain it from organic material within the wastewater. Anaerobic systems are used in many industrial systems including food production and municipal sewage treatment systems.
Anaerobic digestion is commonly used to treat sludges in the first areas of a wastewater treatment plant. This process is popular because it is able to stabilize the water with little biomass production. Anaerobic treatment occurs in many different stages. The key microorganisms are methane formers and acid formers. The acid formers are microorganisms that create various acids from the sludge. Methane formers convert the acids into methane.
The two main anaerobic systems are batch systems and continuous systems. In a batch system, the biomass is added into a reactor that is sealed for the rest of the digestion process. This is the simplest form of anaerobic treatment but can have odor issues associated with it. As the most simple, it is also one of the least expensive ways to achieve treatment.
A continuous system has organic matter constantly added to the treatment system. Since it is continuously being fed, there is a need for the byproduct to continuously be removed. The byproduct can result in a constant source of biogas, which can be used as an alternative source for energy. This system is usually more expensive to operate because of the need for constant monitoring and manpower.
Biogas is produced as the bacteria feed off the biodegradable material in the anaerobic process. The majority of the biogas produced is methane and carbon dioxide. These gases can be stored and used for energy production. The methane in the biogas can be burned to produce heat and electricity. The heat and electricity can be used to aid the process of the anaerobic system by providing power and heat for digestion to occur.
Biogas can also be used as an alternative source for fuel. This has received a lot of attention due to the ever-rising cost of burning fossil fuels. To produce fuel, the biogas must be treated to reduce or eliminate hydrogen sulfide. The treatment may become expensive but is necessary because the EPA has strict limits on the amount of hydrogen sulfide released into the atmosphere.
Whether it is aerobic or anaerobic treatment, each treatment system has its place in the world today. They are very different in the process but both are used to achieve maximum degradation while meeting the strict regulations set by the environmental agencies that regulate what is released into the air, ground, or water.
In wastewater treatment plants (WWTPs), bacteria need a constant biochemical oxygen demand (BOD) loading source to sustain their population. Periods of low loading could negatively affect bacteria and lead to a low population, resulting in insufficient biological treatment. During outages, shutdowns, or times of low loading, WWTPs often use an alternative source of carbon to sustain the bacterial population so that it can respond adequately to a sudden increase in loading. Historically, both dog food and glycerin have been commonly used sources of alternative carbon during times of low loading.
EBS evaluated both dog food and MicroCarb as alternative carbon sources to determine the cost per pound of BOD provided by both products and any other notable differences. The pounds of BOD provided per pound of each product were measured by performing a conventional 5-day BOD test. Additionally, amount of chemical oxygen demand (COD) was measured to determine the ratio of BOD to COD. The cumulative oxygen uptake of each product consumed by a mixed liquor sample from a refinery wastewater treatment plant was
also measured using respirometers.
Figure 1 shows grams of COD and BOD available per gram of carbon source, based on the results of BOD5 and COD testing. Although dog food provided more mass of COD per pound of product, MicroCarb provided more mass of BOD per pound of product. This indicates that the dog food contains a larger fraction of inert, or non-biodegradable, material than the MicroCarb. A higher mass of BOD per pound of product is preferable because it contains a larger amount of readily biodegradable material for bacteria to consume. This is important because WWTPs seek to add the least amount of product possible, with the largest return, in order to have the most cost feasible and least labor-intensive option to increase the amount of food available to the bacteria during times of low process loading.

Figure 2 shows the percentage of BOD to COD for each product, based on the results of BOD5 and COD testing. MicroCarb provided an overall greater biodegradable fraction (0.64 lbs BOD/lb COD) compared to dog food (0.24 lbs BOD/lb COD). Another notable difference is the physical nature of each product. Dog food, even when ground into a powder-like product, does not readily go into solution and contains a much larger inert fraction. This inert fraction is indicated by the amount of COD that does not include BOD. This physical property may account for the lower BOD percentage since the bacteria may take longer to break down the solids. In comparison, MicroCarb is fully soluble in water which allows the product to be more easily mixed into a treatment system and accessed by bacteria.

The oxygen uptake data gathered during respirometric testing is provided in Figure 3 below. Cumulative oxygen uptake data obtained from respirometry studies provides an indication of the amount of food consumed by bacteria, much like a BOD5 test. A higher cumulative oxygen uptake indicates a larger biodegradable fraction, as the bacteria consume oxygen while removing BOD. Both products were evaluated at three concentrations, at ratios that equalized the amount of COD added between products. Three substrate to biomass ratios (lb COD/lb VSS) were tested: 0.2, 0.4, and 0.6. Figure 3 indicates that for every ratio tested, MicroCarb delivered more BOD than dog food as indicated by higher cumulative oxygen uptake. This supports the results of the BOD5 and COD testing but demonstrates that a mixed liquor sample received more biodegradable material in every pound of COD provided by each product.

To assess the cost of BOD provided by each carbon source, EBS tested the initial BOD content of both dog food and MicroCarb, then determined the cost per pound of BOD provided by each source. These costs are provided in Figure 4. Price estimates for a pound of dog food were generated from a price match of a 52 lb bag from Walmart. MicroCarb price per pound was generated from EBS retail price. The market prices of each product are subject to change.

Environmental Business Specialists, LLC (EBS) was contracted to perform an inhibition assessment to...
Aerated Stabilization Basin (ASB) performance issues can be associated with several root causes, both chronic and intermittent. Events such as temporary upsets frequently occur due to spills, increased production, or high effluent flow rates. It is critical to be able to assess the wastewater treatment system performance during these times. In doing so, you gain a better understanding of your lagoon performance, which will assist you later when troubleshooting issues.
Performance can be evaluated while running tests to comply with permit limits or taking a more proactive approach through process control testing. It’s important to be educated on ways to monitor the health of the system to begin identifying arising issues to try and avoid potential violations and loss of system performance.
Process control testing typically consists of COD, BOD, TSS/VSS, DOUR, nutrients, DO, pH, and a variety of others. Knowing the right parameters to run for each process control, the correct methods and procedures, frequency of testing, proper sample locations, and lastly, a general understanding of the 8 Growth Pressures are all key to maintaining healthy process control.
A growth pressure is any critical factor affecting the microbial community. Whether it’s one or several growth pressures that are limiting, each of them can have a profound effect on the overall health and efficiency of the system. Through consistent monitoring and an understanding of the role of each growth pressure, operators and environmental personnel can diagnose the areas of poor performance that need to be addressed.
Because of a lagoon’s long retention times, ongoing volume loss, and gradual performance loss, it is easy to ignore an ASB in the name of cost reduction. However, failure to routinely monitor and assess the performance and capacity of the system can lead to compliance issues and may put you in a difficult situation to defend. Listed below are several ways to monitor each of the Growth Pressures both on a frequent (daily or weekly) basis and infrequent or as-needed basis:
Process control is critical for identifying and troubleshooting issues with lagoon performance. Routine testing and monitoring of the system’s health provide professionals with a greater understanding of the lagoon’s performance. Proper process control makes identifying performance issues easier and quicker. It also makes troubleshooting more proficient by knowing what a healthy system looks like when operating at peak performance. Don’t wait to begin testing after an issue arises start routine testing by establishing a good process control.