Denitrification Support with EBS CalNit™
Nutrient removal can be a complex challenge for biological wastewater treatment plants, often requiring constant adjustment to get it just right.
Some wastewater...
Posts by:
Nutrient removal can be a complex challenge for biological wastewater treatment plants, often requiring constant adjustment to get it just right.
Some wastewater...
Wastewater managers and operators want confidence that their facility’s chemical program will not negatively impact their biological treatment system. Whether you are a chemical supplier or product end user, EBS can assess chemical additives for impacts on microbiological activity.
Utilizing respirometry, EBS can continuously measure oxygen uptake or gas production, and therefore BOD removal, from a biomass exposed to different controlled conditions. To complement these results, we can also use Flow Cytometry, which measures the proportion of live and dead cells in each sample using nucleic acid stains. This dual approach provides both a metabolic and cellular view of microbial health under chemical stress.
In the case study below, three different doses of biocide used in upstream processes were added into reactor bottles containing the facility’s activated sludge biomass and typical influent at three different concentrations, in addition to the treatment plant biomass and aeration basin influent.
Well-functioning primary clarifiers are essential for wastewater treatment efficiency. However, they are often overlooked when diagnosing the causes of declining effluent quality. Their primary function is to remove insoluble BOD (such as fiber) and inorganic solids (like lime and ash), thereby reducing the load on the biological treatment stage.
From a cost-saving perspective, primary clarifiers remove more BOD and TSS for less operational expense than any other treatment process, as rejected fiber from the process can contribute up to 0.4 pounds of BOD per pound of TSS.
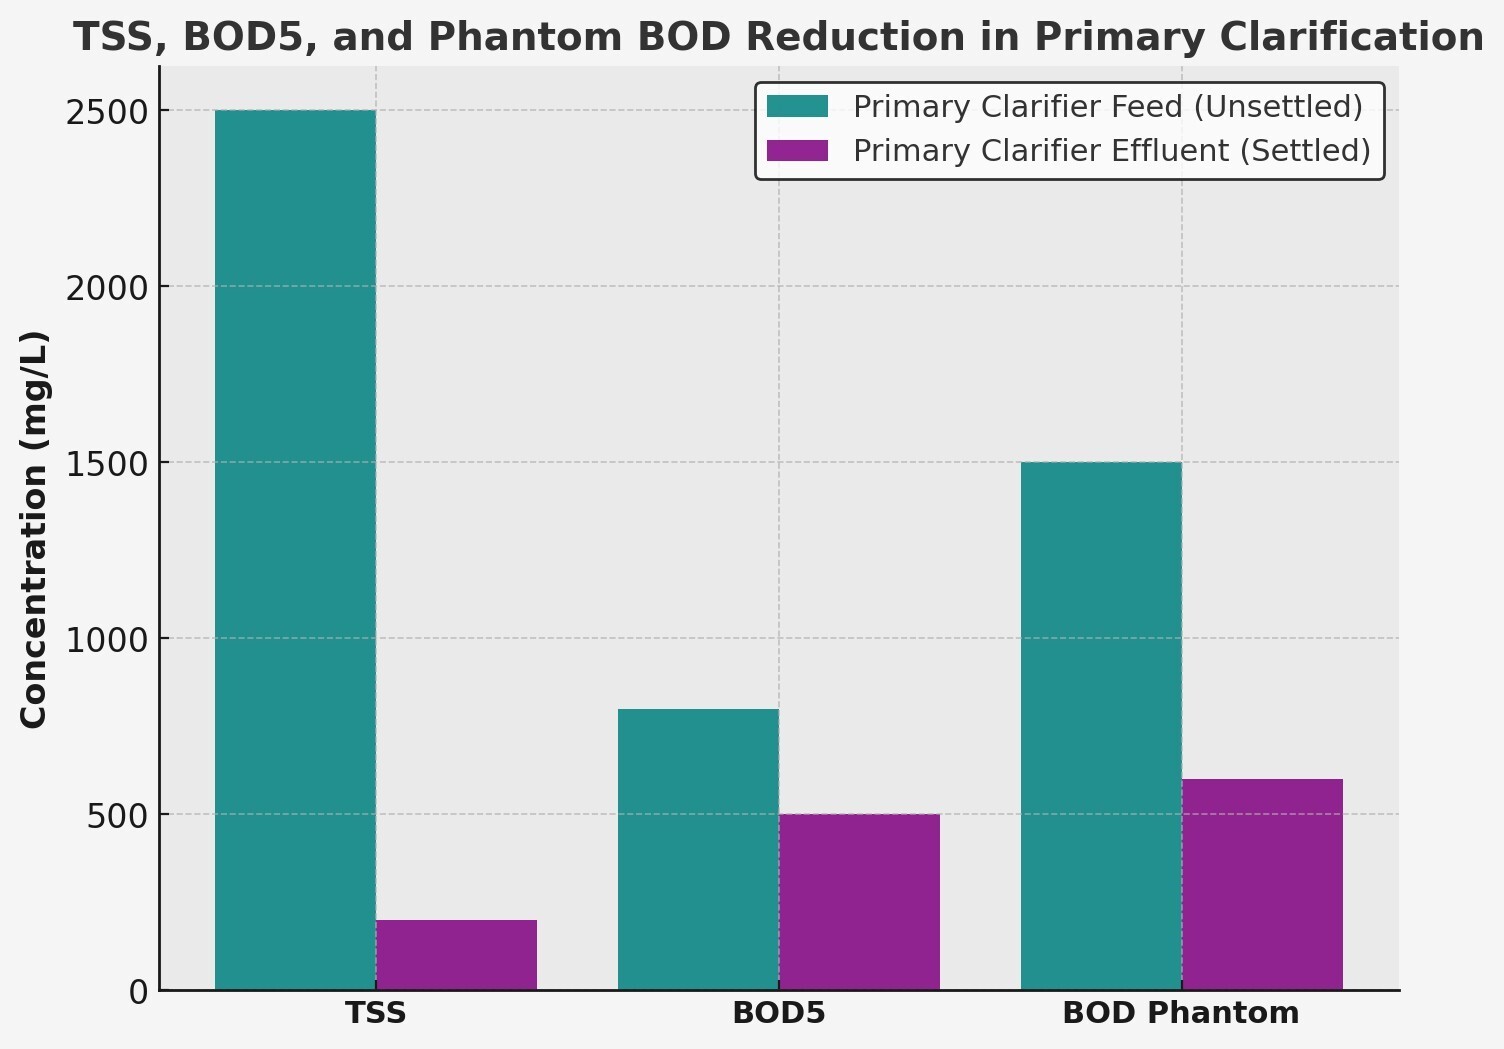
The diagram shows the difference between what enters the primary clarifier versus what leaves.
Green bars represent the TSS and BOD concentrations coming into the Unsettled Primary Clarifier Feed from the mill. If operators bypass the clarifier, this feed will go directly into the ASB.
Purple bars in the diagram represent the TSS and BOD concentrations in a typical Settled Primary Clarifier Effluent. These concentrations typically enter the ASB when the primary clarifier is functioning correctly.
Phantom BOD represents the insoluble portion of BOD that will not show up in the 5- day BOD test. This fraction will settle out somewhere in the ASB and break down to soluble BOD, creating additional oxygen demand later on. The primary clarifier significantly reduces the phantom BOD load to the ASB in this example. As seen in this diagram, a primary clarifier serves not only to reduce TSS but also a significant portion of BOD. Since more solids enter the ASB when bypassing the clarifier, bacteria will need time to acclimate to the higher BOD loading. There will likely be carryover of BOD and TSS into the effluent. Also, since more phantom BOD will be added to the ASB, the consequences of clarifier bypass may be seen weeks later in the treated effluent.
Our experienced wastewater consultants help you closely monitor trends in primary clarifier performance, providing early detection of issues before they escalate. We also help ensure the biological portion of your treatment system remains resilient, even during periods when primary clarifier performance fluctuates!
Winter’s colder temperatures bring a host of operational challenges for wastewater treatment facilities, particularly in the biological nitrification...
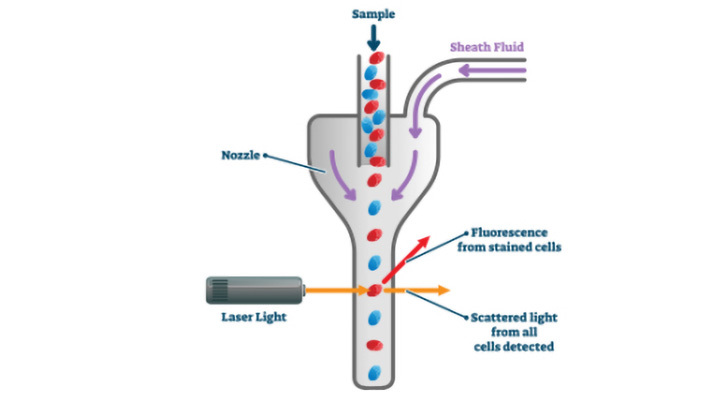
Flow cytometry is a laser-based technology that rapidly analyzes a single cell or particle of interest using fluorescent nucleic acid stains. This powerful tool has...

Wastewater management is a multifaceted endeavor. Below are five critical areas that can significantly enhance your system’s effectiveness.
1. Generating reliable laboratory data
While it’s true what they say, “you can’t control what you don’t measure,” at times, you may be controlling for things that aren’t there. Ensuring that your on-site laboratory is generating reliable data is the first step to better understanding your wastewater treatment plant (WWTP). Virtually everything we know about system performance comes from lab data. If that data is misleading (or worse, flat-out wrong), it can have you chasing phantom problems. EBS worked with a facility in the past where loading was thought to have recently increased by more than double. Capital expenses were approved, system design changes were put in place, but no measurable effect was produced. Eventually, through a laboratory assessment, it was determined that COD/BOD testing was being done incorrectly and thus was yielding greatly exaggerated numbers. Staff turnover lead to diminished experience, and testing reliability was the cost. Erroneous data was being used to make process changes that, in the end, proved unnecessary. Ensure your data is reliable first, then act.
2. Monitor the eight growth pressures
Once you have established that your analytical processes are reliable, you need to determine what to monitor. The eight growth pressures are an excellent place to start. The growth pressure is the factors that often determine the success or failure of a biological treatment system. Keeping these growth pressures in their respective target range is essential for maximizing treatment efficiency. Most, if not all, of these growth pressures can easily be monitored through routine lab testing or online measurements. In some cases, a surrogate test can be performed and correlations drawn, increasing efficiency and speeding up the decision making process. COD testing, for instance, is commonly used to predict BOD loading. Each facility’s COD:BOD correlation will be unique, so spending the time to understand this relationship is essential. Once a good correlation is established, swings in loading can be detected in 2 hours rather than having to wait five days.
3. Establish Key Performance Indicators (KPI)
After making sure that you can produce reliable data and knowing what to test for, establishing Key Performance Indicators (KPI’s) is an ideal next step. KPI’s allow you to set “guardrails” for the most important parameters in your WWTP. KPI’s should be determined on a site-specific basis, but typically include things like influent loading, flow, COD removal across an aeration basin, nutrient residuals, dissolved oxygen levels in an aeration basin, or clarifier turbidity. Every treatment plant will have its own sense of what “normal” is, so generating an adequate amount of baseline data under normal operating conditions is the best course of action. From this baseline, high and low guardrails can be set. These guardrails can be used to instantly understand where operations stand. After establishing guardrails, putting solid corrective actions in place for each KPI will help you resolve issues more quickly. If influent COD rises above a certain level should water be diverted to a holding pond or pond levels raised? If pH falls below a certain level should the automatic caustic feed kick on? Having a plan in place for situations like this before they happen allows you to be proactive rather than reactive and prevent small upsets from becoming big problems.
4. Well trained operators
Established KPI’s are essential for engineers to analyze WWTP efficiency, but the operators are the front line of defense. They should not only be well trained in the technical aspects of operating the equipment, but also in what their KPI’s are telling them. If COD values rise above X, do the operators understand what levers they can pull? If nutrient levels fall below the given guardrail, what should the nutrient pump rate be increased to? Why does the DO need to remain above 2 mg/L, and what does it mean if it suddenly plummets? The operations staff must be just as informed as the engineers on what the growth pressures and KPI’s are telling them, and what options they have at their disposal to affect change. Our semi-annual wastewater seminars and routine workshops are a great place to start if you need to improve your operator traning.
5. Advanced Monitoring Program
At times, all systems have issues that can’t be easily solved using a traditional monitoring approach. Keeping tabs on the eight growth pressures will allow you to keep the system between the lines most of the time, but anomalous conditions do arise. Having a routine monitoring program at your disposal can be a useful safety net. This may consist of routine data analysis, microbiological testing, or on-site consulting. Perhaps settleability in a secondary clarifier has worsened despite no apparent change in loading. It could be due to filamentous bacteria, and chlorination may be the solution. However, it could be from the overproduction of polysaccharides, and chlorination would exacerbate the problem. Advanced microbiological testing performed on some regular frequency (monthly, quarterly, etc.) will allow you to have a good baseline of even the most complicated parameters, ensuring you are armed with the information required to make the right decision. Established guardrails will also need to be adjusted over time due to changes such as decreased retention time, an increase in production, or tighter permit limits. A systematic schedule for data review helps address challenges prompted by these changes, ensuring continuous awareness and adaptability. This proactive stance enables timely adjustments and maintains the system’s compliance and performance.

EBS recently assisted a paper mill with odor issues associated with their aerated stabilization basin (ASB) wastewater treatment system. The formation of reduced...