See What’s New – Track Visitor Behavior and Website Engagement in One Dashboard
The new
Engagement Analytics dashboard is now live in the Performance drop down in the iCommand Center at no additional cost and with no setup required. Starting now, you can access daily insights into how customers interact with your digital storefront.


Why Engagement Analytics Matters
Understanding how buyers navigate your website is crucial to converting interest into sales. The Engagement Analytics dashboard is designed to give you a clear picture of website activity—from vehicle detail page (VDP) views to leads generated—so you can identify which vehicles drive the most interest and make more informed decisions about inventory and marketing. The Engagement Analytics dashboard provides easy-to-read, in-depth data across multiple dimensions:- Changeable Timeline: View engagement trends over different periods (last year, year-to-date, last 12 months, last 90 days, or last 60 days).
- Data at a Glance: Quickly see totals for visitors, website searches, VDP views, leads, and click-to-call activity.
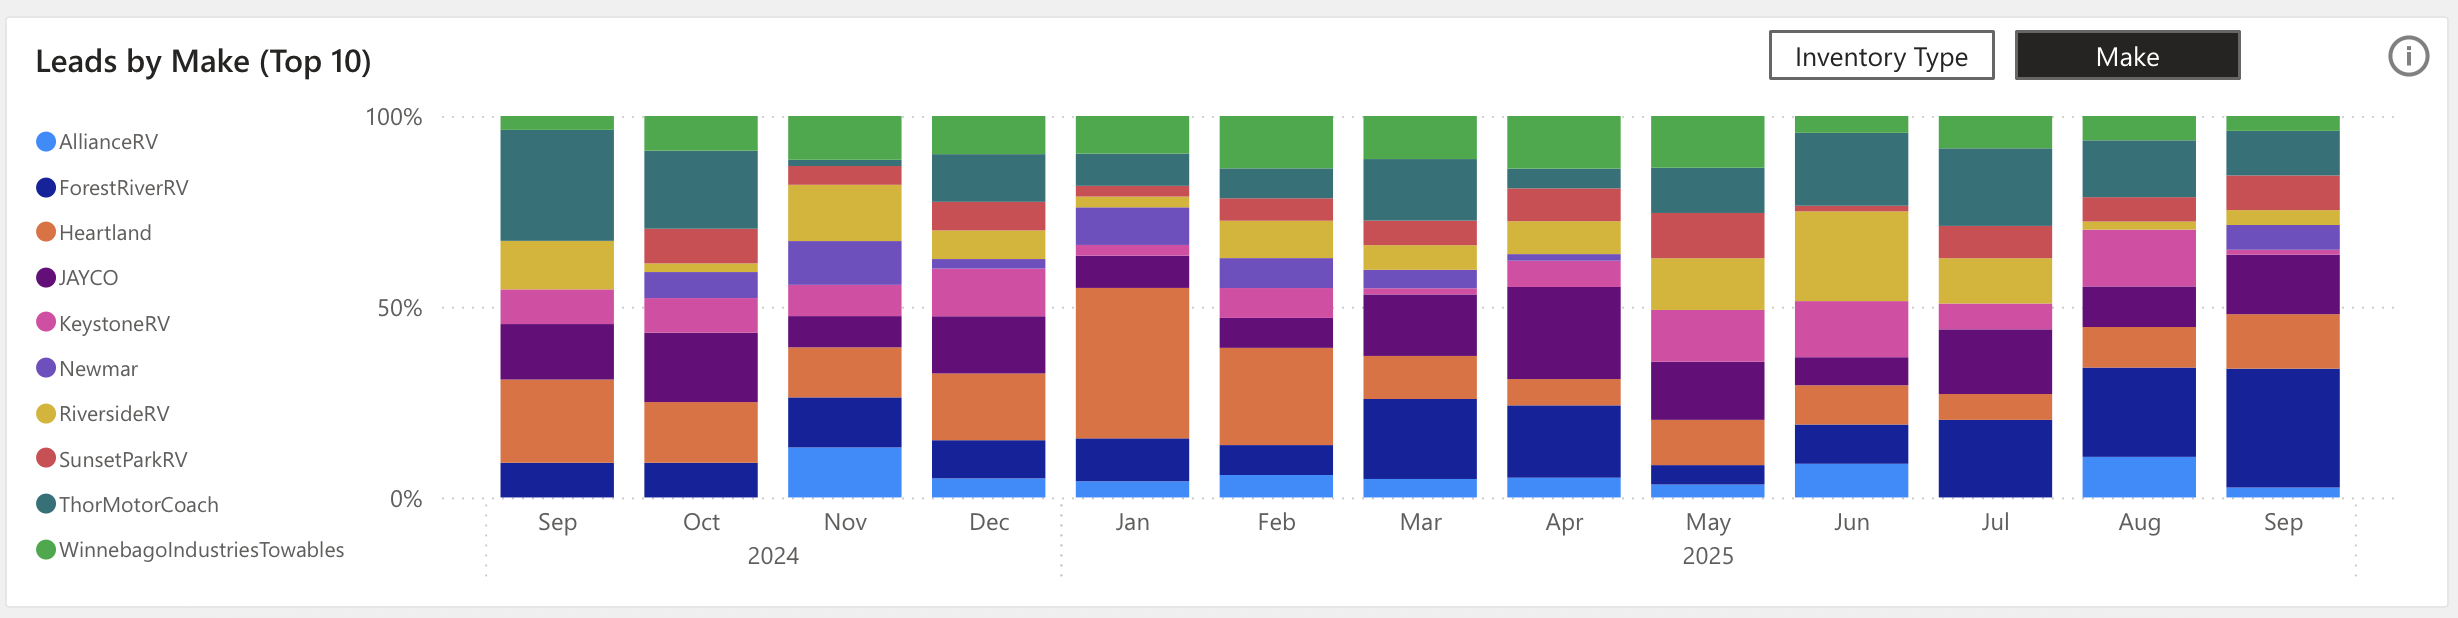
- Leads by Inventory Type or Make: Identify which categories and brands generate the most interest.
- Engagement by Vehicle: Track VDP views and leads on a vehicle-by-vehicle level.
- VDP Views & Leads by Inventory Type: Understand how different segments of your inventory are performing.
- VDP Views & Leads by Make: See which OEM lines are driving the most attention and inquiries.
